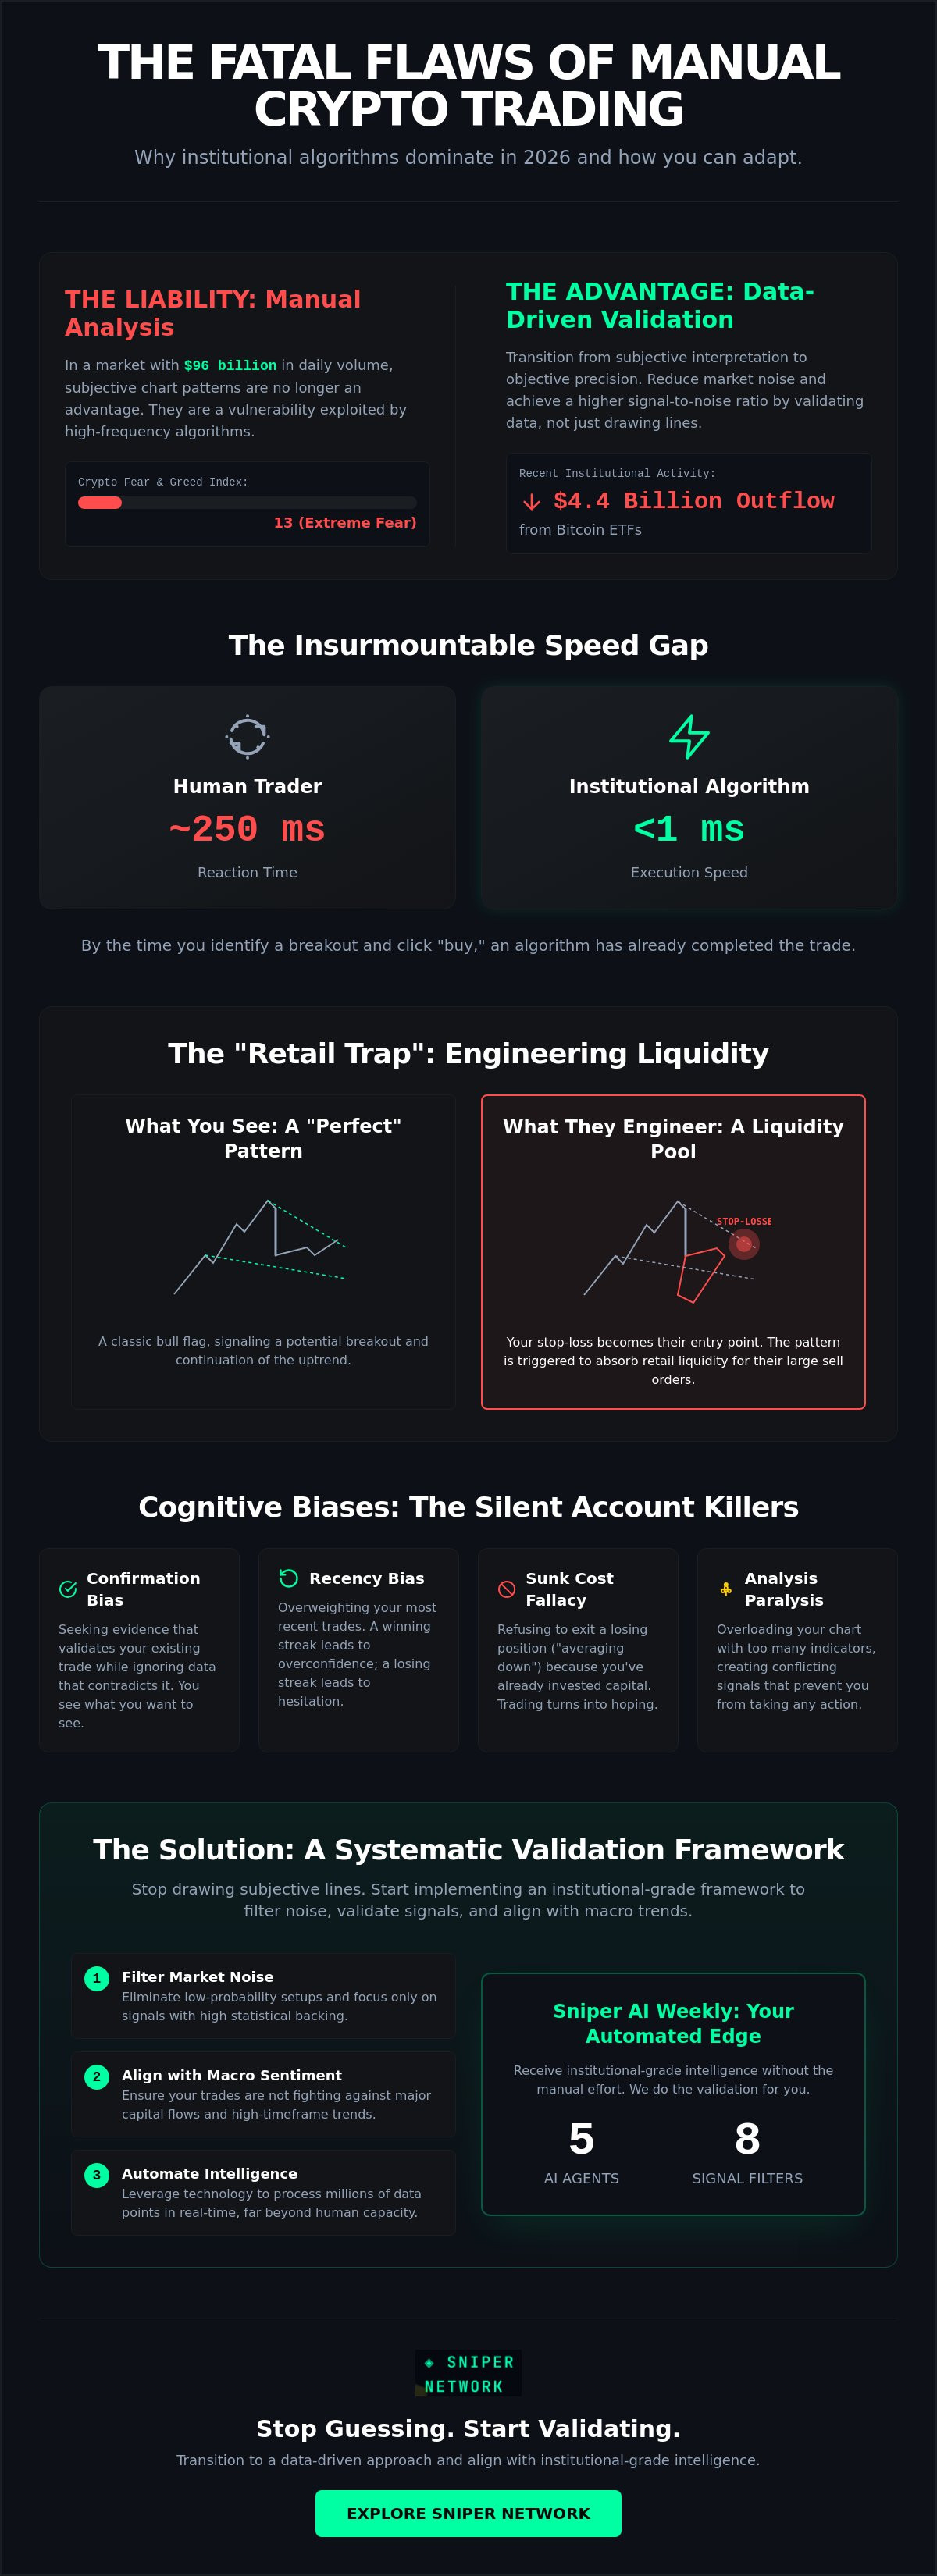
Why does your "perfect" bull flag result in a stop-out while institutional algorithms extract liquidity? In June 2026, manual charting is no longer a competitive advantage. It's a liability. With the Crypto Fear and Greed Index at a staggering 13, emotional bias is at an all-time high. You've felt the exhaustion of manual monitoring. You've seen the market ignore your trendlines during the recent $4.4 billion institutional outflow from Bitcoin ETFs. These common crypto technical analysis pitfalls aren't personal failures. They are systemic.
You recognize that the $96 billion in daily volume isn't moved by retail drawings. It's moved by data. We'll identify exactly why manual TA fails in this high-frequency environment. You'll learn how to transition to a data-driven, institutional-grade validation framework. This guide provides the blueprint to reduce market noise and achieve a higher signal-to-noise ratio. We'll preview the shift from subjective interpretation to objective, automated precision. Stop guessing. Start validating.
Key Takeaways
- Identify the structural crypto technical analysis pitfalls that transform common retail chart patterns into liquidity traps for institutional algorithms.
- Eliminate the cognitive biases and emotional exhaustion that lead to frequent stop-outs on statistically perfect setups.
- Understand the mathematical lag of legacy indicators like RSI and MACD in a sub-millisecond, high-frequency trading environment.
- Implement an 8-layer validation framework to filter market noise and align high-timeframe trends with macro sentiment.
- Learn how to automate institutional-grade intelligence using 5 AI agents and 8 signal filters through Sniper AI Weekly.
The Structural Failure of Manual Technical Analysis
Manual charting assumes a market environment that no longer exists. It relies on the outdated premise that price action follows a static, predictable loop. In 2026, the $2.14 trillion global crypto market is too fast for manual observation. Subjective drawings on a screen can't account for $96 billion in daily volume moved by high-frequency algorithms. This reliance on visual pattern recognition is the root of most crypto technical analysis pitfalls. You aren't trading against other humans; you're trading against sub-millisecond execution engines.
The "Retail Trap" is a deliberate institutional strategy. Large-scale players use common chart patterns to engineer liquidity. When you see a "perfect" bull flag, an institutional algorithm sees a cluster of retail stop-loss orders. They trigger these patterns to entice buy-side liquidity, allowing them to fill massive sell orders at optimal prices. This is why your most confident setups often precede the most violent reversals. The market doesn't ignore your trendlines. It uses them against you.
Human reaction time is approximately 250 milliseconds. Institutional engines operate in the sub-millisecond range. By the time you identify a breakout and click "buy," the move is already exhausted. You're entering at the tail end of a cycle that was validated and executed by machines before your brain could process the signal. This speed gap is insurmountable for manual traders.
The Evolution of Market Microstructure
Order books have shifted from human-led negotiations to algorithmic dominance. In 2026, liquidity is fragmented across global, 24/7 exchanges, rendering traditional "market close" signals irrelevant. Price discovery happens in the gaps between retail observations. Market microstructure in 2026 represents the complex interaction of high-frequency algorithmic order flows that dictate price discovery across fragmented global liquidity pools.
Why Historical Patterns Are Losing Predictive Power
Alpha decays as soon as a pattern becomes public knowledge. Machine learning models now front-run retail pattern recognition by identifying micro-trends before they manifest on a standard candle chart. Many traders suffer from various cognitive biases, leading them to find "patterns" in random market noise. There's a clinical difference between data-driven trends and subjective drawings. Machines prioritize the former. Retail traders are trapped in the latter, chasing ghosts in the data while institutional agents harvest their capital. Successful navigation requires a shift from drawing lines to validating data streams.
Cognitive Biases: The Silent Killers of Crypto Trading
The human brain is optimized for survival, not sub-millisecond digital asset execution. This biological mismatch creates the most dangerous crypto technical analysis pitfalls. Confirmation bias is the primary offender. You seek evidence that validates your existing long position while filtering out bearish volume spikes or negative macro data. You don't see the market; you see your own expectations. This subjective filtering turns a technical chart into a Rorschach test where you only find what you want to find.
Recency bias further distorts your risk management framework. You overweight your last three trades. If they were profitable, you ignore risk parameters and increase leverage. If they were losses, you hesitate on high-probability signals. This inconsistency destroys long-term expectancy. Academic research into the profitability of technical trading rules suggests that while certain rules hold statistical weight, their manual execution is almost always undermined by these psychological lapses. You aren't a machine. You can't maintain the same clinical neutrality for 1,000 consecutive trades.
The sunk cost fallacy leads to the lethal practice of "averaging down" on failing setups. You treat a broken trendline as a personal challenge. Instead of exiting at a predetermined stop-loss, you add capital to a losing position to lower your entry price. You're no longer trading; you're hoping. This is often followed by analysis paralysis. You layer 15 different indicators on a 5-minute chart. The resulting noise creates conflicting signals that prevent execution. You're frozen while the market moves against you.
The Psychology of the "Fakeout"
Market makers understand retail psychology. They engineer price action to trigger emotional responses. Rapid, low-volume pumps induce FOMO, drawing in retail buyers before a massive distribution. These are biological traps. High-stress volatility triggers the amygdala, overriding the prefrontal cortex. You can't think logically when the Fear & Greed Index is at 13 and $4.4 billion in ETF outflows are hitting the tape. Manual traders struggle to exit because their biology demands they wait for a "bounce" that never comes.
Eliminating Emotion through Systematic Logic
Success requires moving from "I think" to "The data validates." Automation is the only way to bypass the human amygdala during market crashes. A clinical approach requires removing the human from the decision-making loop entirely. You need a system that monitors 24/5 without fatigue or ego. For those seeking to remove these biases, adopting institutional-grade systematic logic is the standard for 2026. When you stop guessing and start validating, the noise disappears. Precision replaces hope.
Indicator Lag and Market Noise: The Volatility Trap
Lag is a structural delay. RSI and MACD are 1970s tools in a 2026 sub-millisecond battlefield. They calculate the average of past price closes. They cannot predict a $96 billion daily volume shift or a sudden $4.4 billion institutional ETF outflow. Relying on these lagging metrics is one of the most common crypto technical analysis pitfalls. You're analyzing history while institutional algorithms are writing the future. By the time an RSI divergence confirms, the smart money has already exited. You're left holding the bag of a completed move.
"Indicator Soup" is a retail epidemic. Traders layer redundant data sources, hoping for clarity. They get confusion. Bollinger Bands, MACD, and RSI often signal the same momentum shift. Using three indicators to confirm one move isn't validation. It's repetition. It creates a false sense of security while over-complicating the decision-making process. True signal comes from the volume profile. It shows where the real money is parked. Price is just a symptom of liquidity moving through the order book. If you don't understand where the $2.14 trillion market cap is concentrating, your lines on a chart are meaningless.
Multi-Timeframe Conflict
A bullish 15-minute setup is irrelevant against a bearish 4-hour trend. Retail traders get liquidated because they ignore the macro structure. They see a "perfect" breakout on the micro-scale and ignore the institutional distribution happening on the daily. This interval mismatch is where most stop-outs occur. Integrating systematic crypto trading is the only way to ensure cross-interval confirmation. You need a data-driven framework to filter out the 1-minute noise. High-frequency volatility is designed to trigger retail emotions. Institutional intent is only visible when you align multiple timeframes.
Order Flow and Liquidity Voids
Candlesticks are a simplified abstraction of the market. To survive in 2026, you must read "The Tape." Price doesn't respect diagonal trendlines. It moves to fill liquidity voids. It gravitates toward clusters of orders. Research on cognitive biases in cryptocurrency trading highlights how traders often hallucinate patterns where only random order flow exists. AI agents now identify hidden buy and sell walls in real-time. They detect iceberg orders that never appear on a standard chart. These agents map the liquidity landscape before the price moves. If you aren't monitoring the order flow, you're trading blind. Real money leaves footprints in the book, not on the chart.
Constructing a Systematic Validation Framework
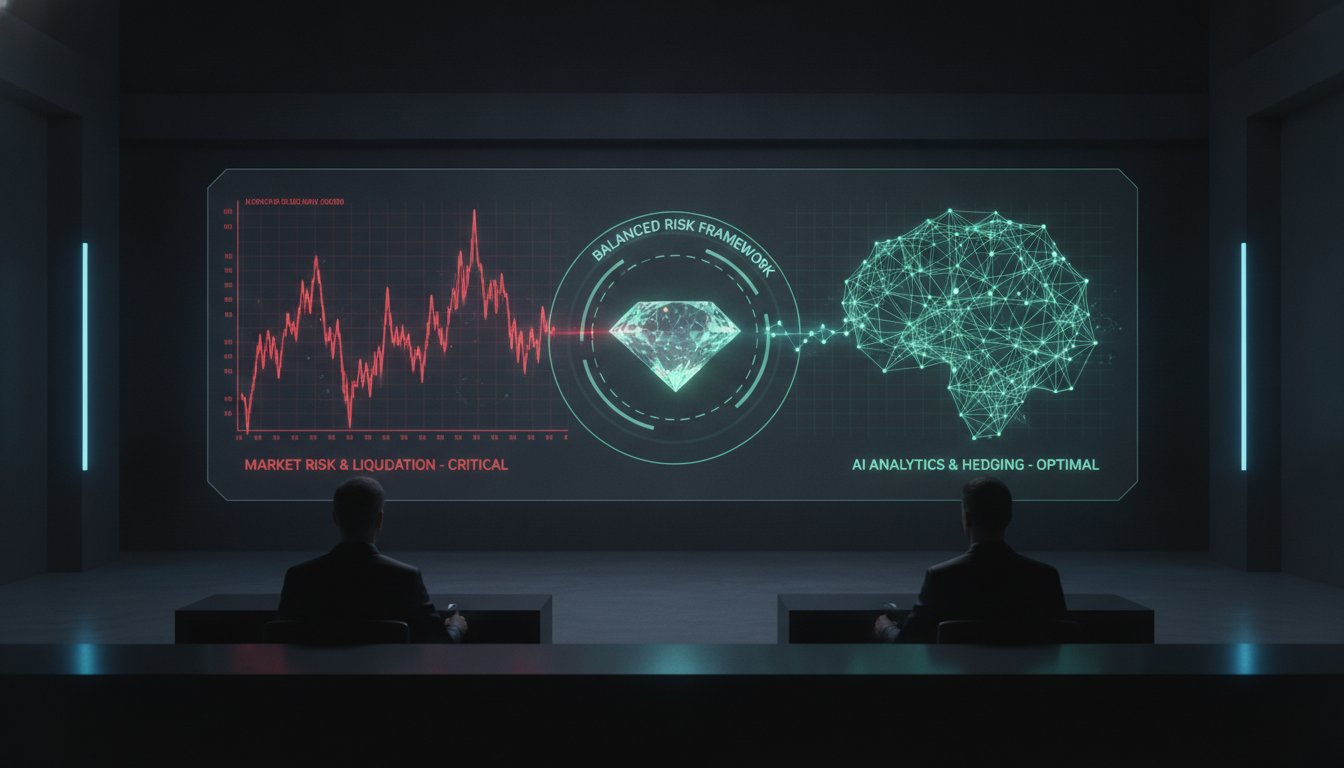
Single-indicator entries are a relic of the past. Relying on a moving average crossover in a market dominated by machine learning is one of the primary crypto technical analysis pitfalls. You need a multi-layered validation framework that treats every trade as a data-backed hypothesis. A systematic approach requires eight distinct layers of confirmation before capital is ever deployed. If any layer fails to validate, the setup is discarded. No exceptions.
Layers 1 through 3 focus on macro sentiment and high-timeframe alignment. You must account for Bitcoin dominance, currently at 55.7%, and the broader regulatory environment, such as the EU's MiCA license requirements effective July 1, 2026. If the high-timeframe trend is bearish, micro-breakouts are statistically likely to fail. Layers 4 through 6 integrate on-chain data and institutional order flow. This involves monitoring the record $4.4 billion outflows from spot Bitcoin ETFs to identify where real money is moving. Finally, Layers 7 and 8 apply AI-driven pattern filtering and volatility assessment to ensure the entry isn't a liquidity trap engineered by market makers.
Filtering Market Noise with AI
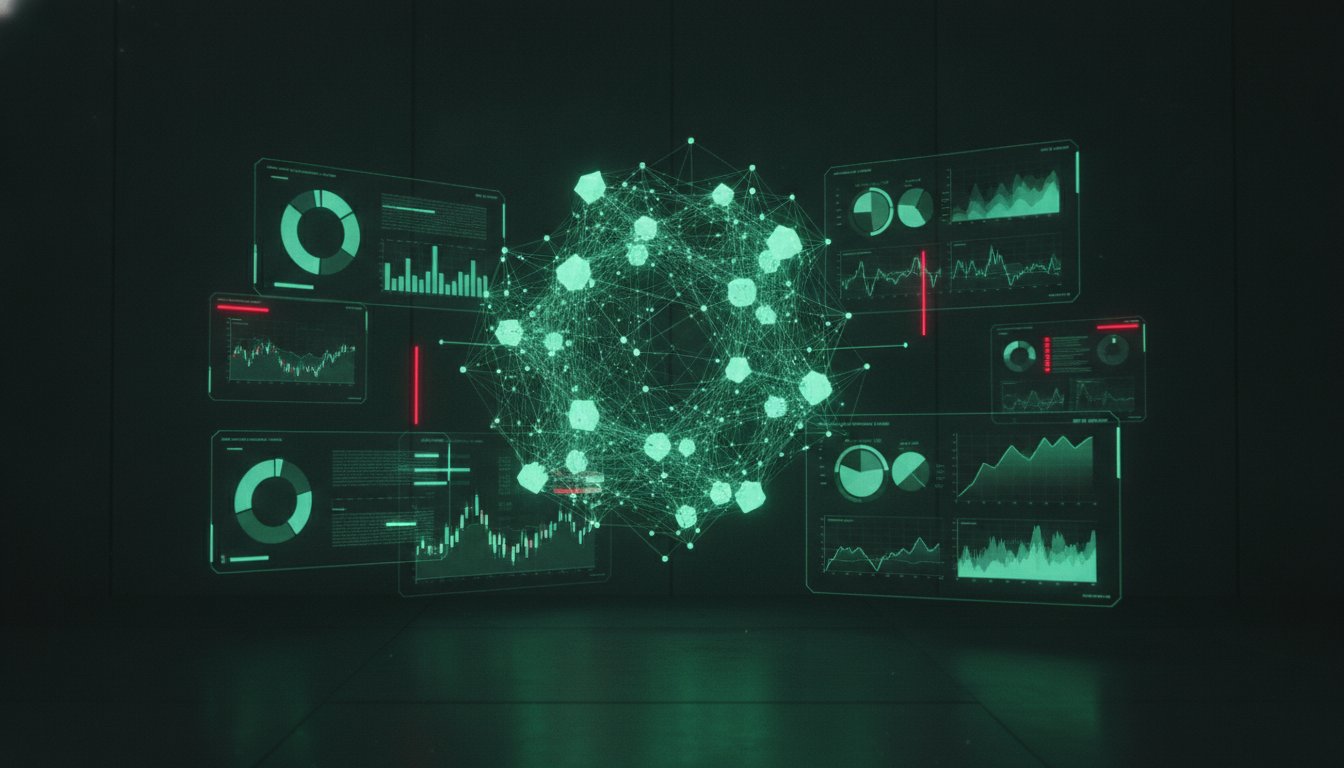
AI agents scan thousands of data points across multiple exchanges simultaneously. They identify genuine reversals by correlating order book depth with social sentiment and macro news. Utilizing ai for crypto market analysis tools is no longer optional. It's a requirement for survival. Automated multi-vector confirmation significantly reduces false positives compared to manual charting. You don't guess. You validate. This process removes the linguistic clutter of "what if" and replaces it with clinical execution.
Risk Management as a Technical Requirement
Risk is the only variable you can truly control. Position sizing must be calculated using crypto risk management tools based on current market volatility and account equity. Intuition has no place in a professional framework. Every trade must have a "Hard Invalidation" rule. This is a pre-defined exit point based on structural shifts in the order book, not just a random percentage. A systematic approach means a 40% win rate remains highly profitable if your risk-to-reward ratio is mathematically sound. Precision execution is the only hedge against market noise.
Stop relying on subjective drawings. Deploy institutional-grade validation now.
Sniper AI Weekly: Automating Institutional-Grade Intelligence
Manual charting is a legacy process. Sniper AI Weekly replaces subjective interpretation with clinical, data-backed insights. It eliminates the crypto technical analysis pitfalls discussed previously by shifting the burden of validation from the human to the machine. You no longer spend hours drawing lines on a screen. You receive institutional-grade intelligence designed for systematic execution. This is the transition from a retail "charter" to a systematic trader. We provide the tools. You provide the execution.
The system utilizes 5 AI agents and 8 signal filters. These agents monitor the $2.14 trillion market cap in real-time. They filter out noise, identify liquidity voids, and validate trends across multiple timeframes. This framework removes human bias entirely. It doesn't "hope" for a bounce or "feel" a reversal. It validates the order flow. Every report is a product of backtested logic and sub-millisecond data processing. It's an elite technician working in the background of your trading desk.
Security is a core protocol. We provide non-custodial intelligence. You maintain 100% control of your assets at all times. The "Your API key, your funds" mantra ensures that we never hold your capital. This is a professional financial tool, not a speculative gamble. You bridge the gap between retail trading and professional floor operations without sacrificing security or autonomy. If you need to maintain privacy during registration for new exchanges or tools, you can visit RentalNumbers.com for SMS verification services. We prioritize reliability and institutional-grade performance over exuberant promises.
The Advantage of Automated Research
The "Elite Technician" never sleeps. Sniper AI Weekly provides 24/5 market monitoring, aligning with traditional institutional hours to capture high-volume moves. Traditional signal groups rely on the subjective whims of a "guru." Our system relies on verifiable, automated intelligence. This allows you to focus on high-level strategy while the AI handles the data-heavy lifting. It scans thousands of data points simultaneously to find genuine reversals and high-probability setups. It's a silent engine working to filter out the noise of the $96 billion daily trading volume.
Getting Started with Sniper Network
Integrating Sniper AI Weekly into your workflow is a frictionless process. It acts as an authoritative validation layer for your current strategy. Stop fighting the crypto technical analysis pitfalls that liquidate retail accounts during periods of "Extreme Fear." Transition to a data-driven framework that removes the amygdala from the decision-making loop. Precision replaces hope. Logic replaces bias. Access Sniper AI Weekly reports today and trade with institutional precision.
Transition to Systematic Validation
The shift from subjective charting to automated intelligence is mandatory for survival in 2026. You've identified the systemic crypto technical analysis pitfalls that transform common retail setups into institutional liquidity traps. You now understand that legacy indicators like RSI cannot compete with sub-millisecond execution engines. Moving forward requires a clinical detachment from market noise; it demands a framework that prioritizes data over intuition. Precision is the only hedge against volatility. Logic replaces bias.
Sniper AI Weekly delivers this technical edge through 5 AI agents and 8 signal filters. Our institutional-grade infrastructure ensures your analysis is backed by the same speed used on professional trading floors. Because we provide non-custodial intelligence, you maintain absolute control of your funds while leveraging the power of automated validation. Stop fighting the tape with manual drawings. Start your Sniper AI Weekly subscription today to replace emotional fatigue with clinical accuracy. Secure your edge in the high-frequency battlefield.
Frequently Asked Questions
What are the most common technical analysis pitfalls in crypto?
The most frequent crypto technical analysis pitfalls include the over-reliance on lagging indicators like RSI and the subjective interpretation of chart patterns. Retail traders often ignore institutional order flow, leading to entries that are easily exploited by high-frequency algorithms. This results in frequent stop-outs on setups that appear visually perfect but lack data-driven validation. Manual charting cannot account for the $96 billion in daily volume moved by machines.
Is technical analysis still effective for Bitcoin and Ethereum in 2026?
Technical analysis remains effective only when transitioned from subjective drawing to systematic validation. In 2026, the $2.14 trillion market cap is moved by algorithmic agents, making manual trendlines highly unreliable for individual traders. Success requires integrating on-chain metrics and institutional order flow into a multi-layered framework. You must move beyond isolated candlestick patterns to identify where real money is concentrating.
How does AI improve traditional crypto technical analysis?
AI improves analysis by processing thousands of data points across multiple exchanges simultaneously. It eliminates human emotional bias and identifies micro-trends invisible to the naked eye. By using 5 AI agents and 8 signal filters, systems can validate reversals based on liquidity voids and hidden buy walls rather than simple price history. This creates a higher signal-to-noise ratio in volatile environments.
Why do my support and resistance levels keep getting "swept"?
Institutional algorithms use retail support and resistance levels to engineer liquidity for large orders. These levels act as magnets for price action because they contain high concentrations of retail stop-loss orders. When price "sweeps" these zones, institutions are filling their positions at your expense. Manual charting fails to account for these liquidity-seeking behaviors, leading to frequent stop-outs on "perfect" setups.
Can beginners use AI for crypto market analysis without technical knowledge?
Beginners can leverage automated intelligence to bypass the steep learning curve of manual charting. Tools like Sniper AI Weekly provide clinical, data-backed reports that handle the complex data-heavy lifting. This allows users to focus on high-level execution while the software monitors the market 24/5 for institutional-grade signals. It replaces the need for years of technical study with immediate, validated intelligence.
What is the difference between a signal group and Sniper AI Weekly?
Signal groups rely on the subjective interpretation of human "gurus" and are prone to emotional bias. Sniper AI Weekly uses 5 AI agents and 8 signal filters to deliver objective, backtested intelligence. We provide a non-custodial framework where you maintain absolute control of your assets at all times. It's an institutional-grade infrastructure designed for precision, not a speculative chat room. Your API key, your funds.
How do I reduce emotional bias in my crypto trading?
Reducing emotional bias requires removing the human decision-making loop during periods of high volatility. Establishing a systematic validation framework ensures that entries are based on data rather than intuition. Automation bypasses the amygdala entirely, allowing for clinical execution based on pre-defined structural shifts in the market. When you stop guessing and start validating, the psychological pressure of trading disappears.
What is the 8-layer validation framework for crypto?
The 8-layer validation framework is a multi-vector system designed to identify and avoid common crypto technical analysis pitfalls. It correlates macro sentiment, high-timeframe trends, and on-chain metrics with AI-driven pattern filtering and volatility assessment. This comprehensive approach ensures that every trade is backed by institutional-grade confirmation across eight distinct data layers. Capital is only deployed when all layers align for maximum statistical probability.