Static risk models are a liability in a market where Bitcoin's 30-day standard deviation has reached 15.645%. Relying on Gaussian distributions in an environment defined by fat tails is a mathematical error that leads to liquidated portfolios. With the EU’s MiCA regulations mandating strict risk management as of July 2026, the era of speculative guesswork is over. You need a system that accounts for non-linear volatility. Integrating AI for crypto market risk assessment is no longer optional; it's the baseline for institutional-grade performance.
You already know that 5% to 10% daily price swings are the rule, not the exception. This guide provides the quantitative framework to calculate Value at Risk (VaR) with clinical precision. We'll move past basic formulas to implement AI-driven methodologies that account for liquidity gaps and the "Fear Theory" of market participants. You'll learn how to master parametric, historical, and Monte Carlo simulations while automating your monitoring for 24/5 coverage. This article delivers the data-driven framework required to reduce trading anxiety and protect capital against the inevitable Black Swan.
Key Takeaways
- Quantify maximum potential loss using 95% and 99% confidence levels to establish clinical capital protection boundaries.
- Understand the fat-tail problem and why traditional models fail during systemic liquidity crunches and extreme market outliers.
- Execute a precise 24-hour VaR calculation using historical and variance-covariance methodologies adapted for 2026 volatility.
- Deploy AI for crypto market risk assessment to automate the identification of high-risk volatility clusters that manual models miss.
- Integrate Sniper AI Weekly to replace slow, static research with automated intelligence that monitors market shifts in real-time.
Defining Value at Risk (VaR) in the 2026 Cryptocurrency Market
Value at Risk (VaR) is a clinical statistical measure used to quantify the maximum potential loss of a portfolio over a specific timeframe. In the 2026 market, where Bitcoin's 30-day standard deviation has reached 15.645%, simple standard deviation is an insufficient metric for capital protection. VaR provides a definitive boundary. It calculates the probability of loss with mathematical certainty. It isn't a prediction of a worst-case scenario; it's a statement of probability regarding capital exposure under normal market conditions. For the institutional trader, VaR is the baseline for setting stop-loss levels and determining optimal position sizes.
The 2026 crypto landscape is defined by high leverage and rapid liquidity shifts. Relying on intuition in this environment is a fast track to liquidation. VaR forces a disciplined approach to risk. It requires the trader to define exactly how much capital they are willing to lose before a trade is even executed. This institutional-grade metric transforms market volatility from a threat into a manageable variable. It provides the data necessary to survive systemic shocks that would otherwise wipe out an unhedged portfolio.
The Three Components of a VaR Statement
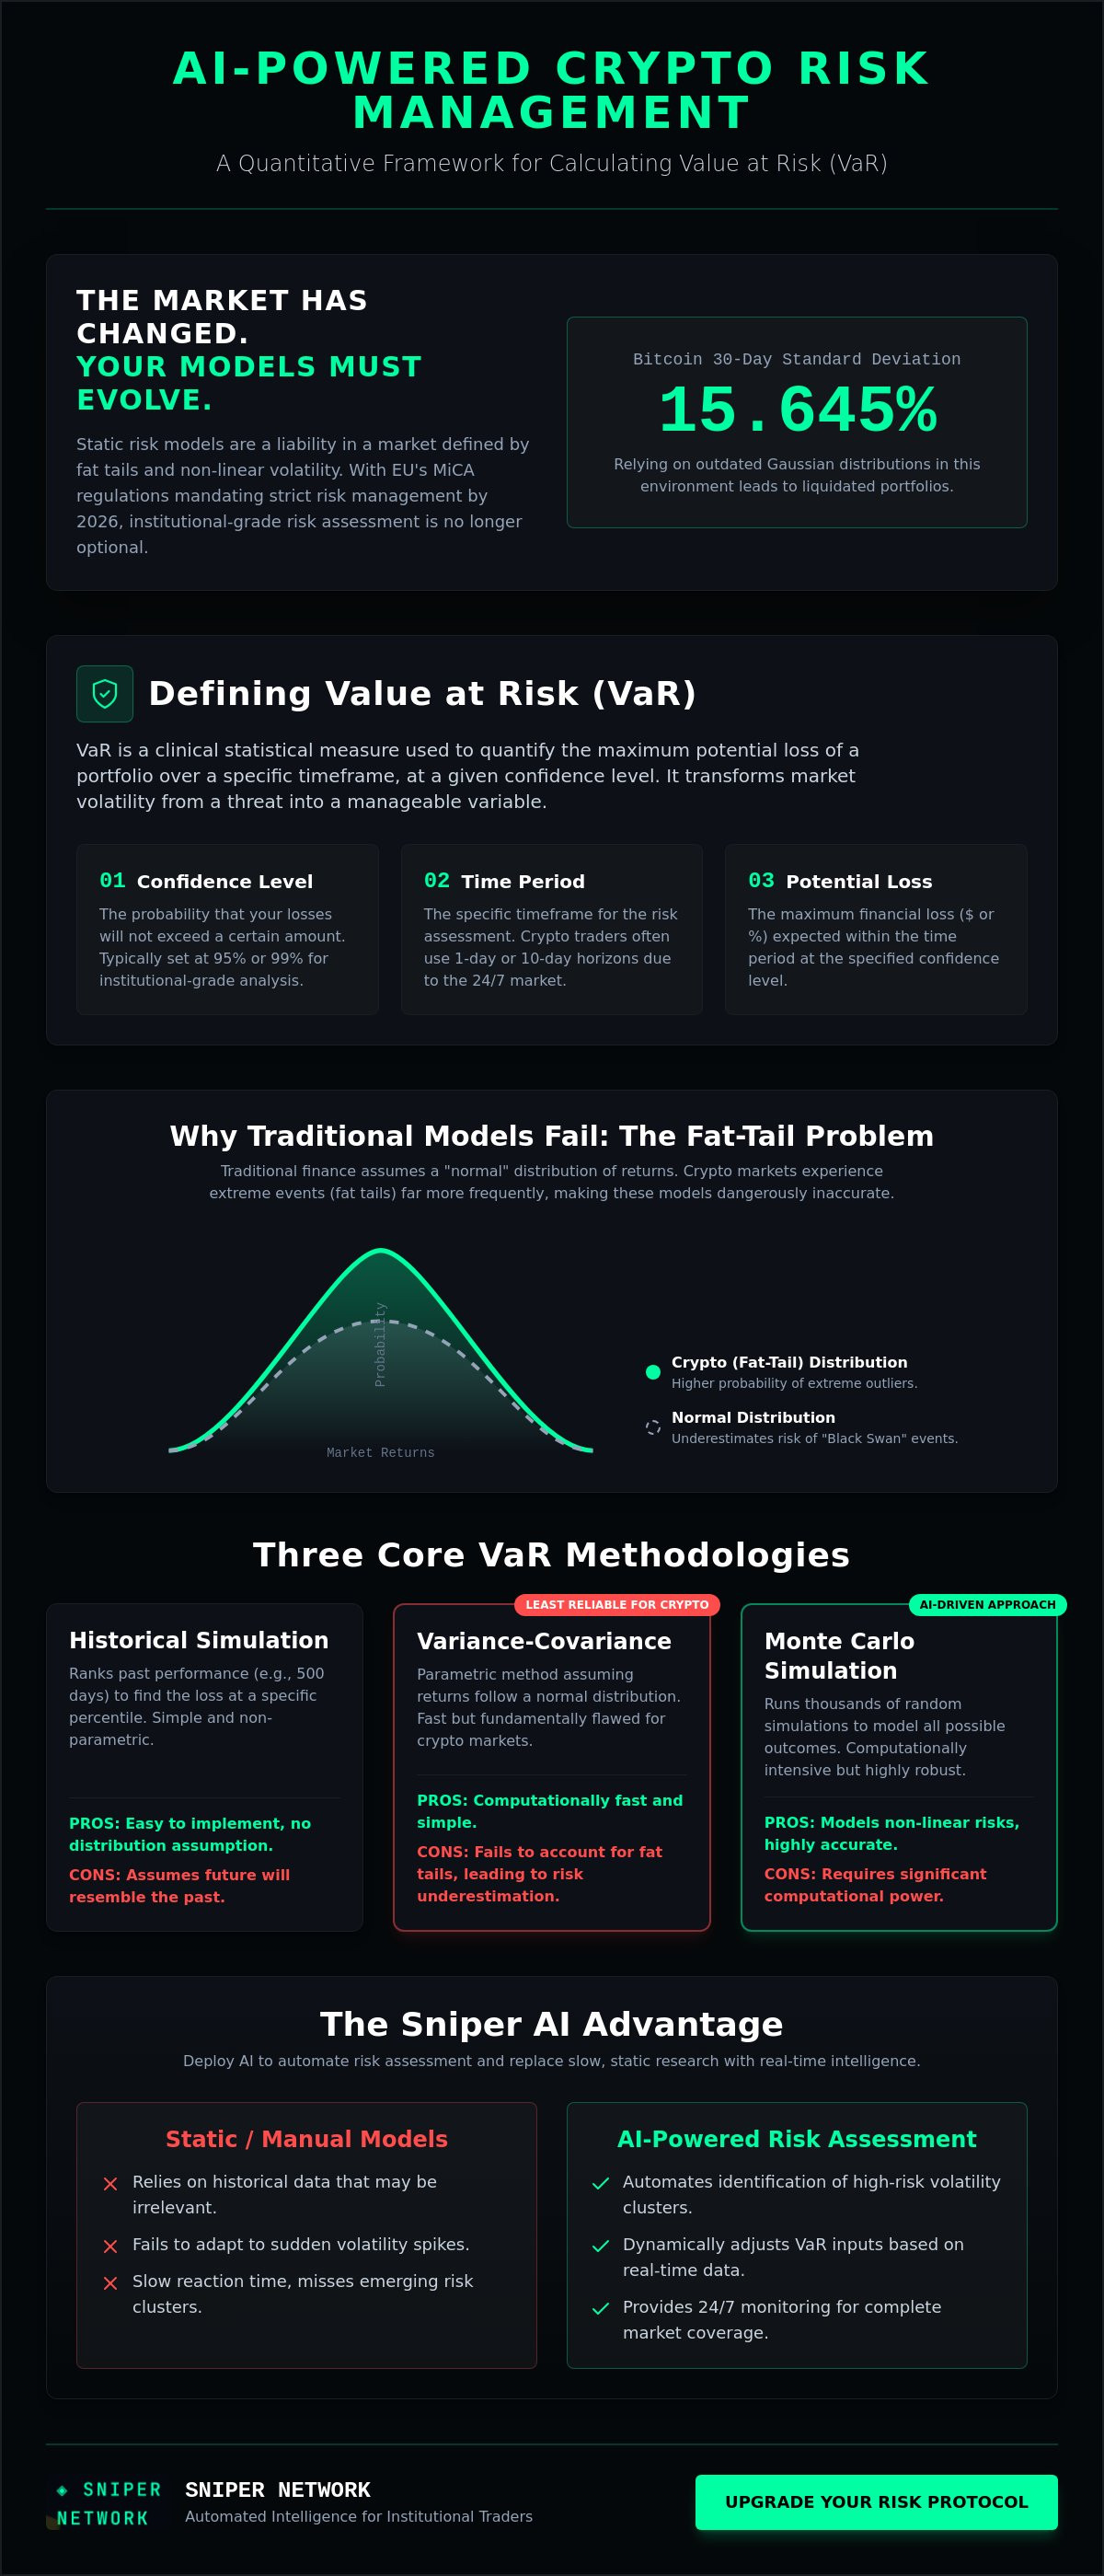
A precise VaR calculation relies on three fixed variables. First, the confidence level. This is typically set at 95% or 99%. A 99% VaR of $10,000 means there is only a 1% probability that your daily loss will exceed that amount. Second, the time period. Crypto traders usually focus on 1-day or 10-day horizons due to the 24/7 nature of the market and the speed of price discovery. Finally, the potential loss. This is the specific dollar or percentage amount at risk. Together, these components transform market noise into actionable data points for your trading engine.
Why VaR is Mandatory for Crypto Portfolio Management
The 2026 regulatory environment, including the EU’s MiCA framework, requires institutional-grade risk transparency. Static models often fail because they don't account for the non-linear "fat-tail" events common in digital assets. Utilizing crypto risk management tools allows you to set stop-loss levels based on mathematical certainty rather than emotional reaction. It moves beyond basic volatility measures to quantify actual downside in real-time.
Risk managers now deploy AI for crypto market risk assessment to validate portfolio health before entering high-leverage setups. These AI systems monitor liquidity clusters and volume profiles to adjust VaR inputs dynamically. This ensures that position sizes remain optimal even when volatility spikes unexpectedly. Without this framework, you're trading blind. VaR provides the technical precision needed to navigate systemic liquidity crunches and protect your principal capital.
The Three Core Methodologies for Crypto VaR Calculation
Quantifying risk in the 2026 crypto market requires a selection between three primary mathematical frameworks: Historical Simulation, Variance-Covariance, and Monte Carlo Simulation. Each method offers a different balance of computational speed and analytical depth. While traditional finance often relies on the Variance-Covariance method for its simplicity, crypto's non-linear volatility makes it the least reliable choice. It assumes a normal distribution of returns, a premise that fails during the 5% to 10% daily swings common in digital assets. For traders seeking institutional-grade results, the choice usually narrows down to historical backtesting or AI-driven simulations.
The computational intensity of these models varies significantly. Historical models are lightweight and fast. Monte Carlo simulations require high-tier infrastructure to run thousands of iterations. Selecting the right approach depends on your portfolio's complexity and the required precision. Advanced traders often integrate advanced non-linear methods for crypto VaR to account for the unique market microstructure of decentralized finance. For most, the goal is to find the sweet spot where accuracy meets execution speed.
Historical Simulation: The Simple Approach
The Historical Method is the most straightforward path to a VaR statement. It bypasses complex assumptions about probability distributions by looking at actual past performance. Typically, a 500-day lookback period is used to rank daily returns from the most catastrophic loss to the highest gain. To find a 95% confidence level, you simply identify the 5th percentile of those returns. If your 5th percentile return is -7%, your 1-day VaR is 7% of your portfolio value. It's a clean, data-driven calculation.
This method's primary advantage is its simplicity. It's easy to calculate and explain. However, its fatal flaw is the recency bias built into the data. It assumes the future will mirror the past. In a market where new regulations like the US GENIUS Act can trigger sudden liquidity shifts, historical data often fails to predict the next systemic shock. It doesn't account for changing correlations between assets during a crisis. It's a reactive tool in a market that demands proactive defense.
Monte Carlo: The Institutional Standard for 2026
In 2026, the Monte Carlo Simulation has become the preferred choice for elite technicians. This method doesn't rely on a single path of historical data. Instead, it uses AI agents to generate thousands of random price scenarios based on current volatility and correlation matrices. It's particularly effective for complex portfolios containing DeFi yield positions and high-leverage futures. By running these iterations, the model captures Fat Tail risks. These are the extreme price outliers that parametric methods ignore.
Deploying AI for crypto market risk assessment allows these simulations to factor in non-linear market movements and sudden liquidation cascades. AI agents can model how a 10% drop in Bitcoin might trigger a cascading failure in a specific stablecoin peg or a DeFi lending protocol. This level of granular detail is what separates professional risk management from retail speculation. If you want to see how these automated agents identify risk clusters before they trigger, you can explore the signal filters used by institutional-grade engines. This methodology provides the clinical precision needed to survive a market defined by rapid, automated execution.
The Fat-Tail Problem: Why Traditional VaR Fails in Crypto
Traditional finance relies on the bell curve. In cryptocurrency, the bell curve is a myth. Digital assets exhibit leptokurtosis, meaning extreme price movements occur with far greater frequency than standard models predict. When Bitcoin experiences its documented 15.645% volatility, the outliers aren't just anomalies; they're the primary drivers of portfolio risk. Standard VaR models often ignore these "fat tails," leading to a catastrophic underestimation of exposure during systemic liquidity crunches. The Global Association of Risk Professionals has highlighted the limitations of traditional VaR in crypto, noting that these models fail to capture the severity of downside events.
The 24/7 nature of the 2026 market accelerates these risk cascades. Unlike traditional equities, crypto has no circuit breakers or closing bells to pause a panic. A liquidation event on one exchange can trigger cross-platform contagion in milliseconds. This speed requires a shift from static snapshots to dynamic monitoring. Implementing AI for crypto market risk assessment allows for real-time recalibration of risk parameters. These systems detect when market conditions shift from normal distributions to high-kurtosis environments. To manage this volatility effectively, traders must deploy ai for crypto market analysis tools that can adjust for non-linear price action instantly.
Overcoming the Normal Distribution Fallacy
Bitcoin and altcoins don't follow a standard distribution. They're characterized by significant skewness and excess kurtosis. In 2026, technical precision requires adjusting formulas to account for these statistical deviations. A 99% VaR statement is insufficient if the 1% chance of failure results in a total loss. This is why elite technicians implement Expected Shortfall (ES). While VaR tells you the threshold of loss, ES quantifies the average loss beyond that threshold. It provides a clearer picture of the damage during a tail event.
The Impact of Leverage and Liquidation Clusters
Cascading liquidations create artificial fat tails in crypto market data. When a specific price level triggers a cluster of stop-losses, the resulting sell pressure is often disconnected from fundamental value. These clusters are exchange-specific and depend heavily on order book depth. AI agents are now used to filter this market noise from genuine trend reversals. By analyzing sub-millisecond data feeds, these agents identify when a price drop is a temporary liquidity vacuum rather than a systemic shift. This level of granular validation is the only way to maintain capital integrity in a high-leverage environment.
Step-by-Step: Executing a Crypto VaR Calculation
Moving from theoretical risk to clinical execution requires a structured workflow. In the 2026 market, manual calculations are often too slow to keep pace with automated liquidity shifts. However, understanding the underlying steps is essential for validating the outputs of your trading engine. Implementing a robust framework for AI for crypto market risk assessment starts with defining your data inputs. This process transforms raw market volatility into a specific dollar amount of exposure. It provides the technical foundation needed to survive systemic shocks without compromising your principal capital.
- Step 1: Define your portfolio assets and current valuations. Conduct a full inventory of your holdings, including spot, futures, and DeFi yield positions.
- Step 2: Select your time horizon. A 24-hour VaR is the standard for crypto due to the 24/7 nature of price discovery and rapid liquidation cascades.
- Step 3: Choose your confidence level. While 95% is common for retail, 99% is the institutional grade required for professional capital protection.
- Step 4: Run the calculation. Use the Variance-Covariance formula for speed or Monte Carlo simulations for higher precision in non-linear markets.
- Step 5: Backtest the model. Compare your predicted VaR against actual historical drawdowns to ensure the model's accuracy.
The Variance-Covariance Formula
The Variance-Covariance method is the most efficient way to quantify risk for linear portfolios. The formula is: VaR = Portfolio Value * (Z-score * Standard Deviation). The Z-score represents the number of standard deviations from the mean for your chosen confidence level. For a 95% confidence level, the Z-score is 1.65. For 99% confidence, it's 2.33. Consider a $100,000 portfolio split between BTC and ETH. If the daily standard deviation (volatility) is 5%, your 99% VaR calculation is $100,000 * (2.33 * 0.05). This results in a VaR of $11,650. This means there's only a 1% probability that your daily loss will exceed this amount under normal conditions.
Backtesting Your Risk Model
A risk model is only valid if it survives contact with real market data. Backtesting involves comparing your predicted VaR against actual daily losses over a 30-day period. If your 99% VaR model produces more than three exceptions (losses exceeding the predicted amount) in a month, your volatility inputs are likely outdated. You must adjust the model to account for excess kurtosis or shifting asset correlations. Integrating systematic crypto trading principles ensures your framework remains dynamic. To automate these calculations with sub-millisecond precision, deploy the Sniper AI engine for real-time risk validation.
◈ Automated Risk Validation: Sniper AI Weekly Intelligence
Manual VaR calculation provides the mathematical foundation for professional risk management. In the 2026 market, it's a static snapshot in a high-frequency environment. Liquidation cascades and systemic shocks occur in sub-milliseconds. A spreadsheet updated once a day is an obsolete defense mechanism. You need dynamic validation. Deploying AI for crypto market risk assessment transforms your risk management from reactive to autonomous. It allows you to monitor volatility clusters as they form, not after they've liquidated your positions. This is the difference between surviving a volatility spike and becoming part of the liquidation data.
Sniper AI Weekly delivers this institutional-grade capability directly to your trading terminal. The system utilizes 5 AI agents and 8 signal filters to maintain clinical precision. These agents monitor global order books and on-chain liquidity 24/5. They identify when historical correlations break down and when fat-tail risks are imminent. This isn't a speculative signal group. It's a technical engine designed to provide data-backed clarity. It validates your calculated risk levels against real-time market microstructure with uncompromising speed.
Sniper AI Weekly: Beyond Static Calculations
Static calculations often fail to account for shifting market sentiment and sudden regulatory triggers like the US GENIUS Act. Sniper AI Weekly automates trend identification across multiple timeframes. It provides a macro-view of portfolio risk that manual analysis cannot replicate. The system operates on a strictly non-custodial basis. You retain full control of your capital at all times. Your API key, your funds. This transparency is the seal of security required for professional trading in 2026. The intelligence reports focus on technical proof rather than emotional appeals, reflecting the "Elite Technician" persona required for modern markets.
Integrating AI Intelligence into Your Workflow
Professional risk management requires a multi-layered approach. Use your manual VaR calculations to set baseline exposure. Then, use Sniper AI Weekly to validate those levels against current volatility clusters. This automated research saves 20+ hours of manual data analysis every week. It removes linguistic clutter and emotional bias from your decision-making process. It moves your operations from a state of constant anxiety to one of data-driven confidence.
You can access Sniper AI Weekly to integrate this data-backed intelligence into your existing framework. It's the final step in moving from retail speculation to institutional-grade execution. By combining the quantitative formulas of Value at Risk with automated AI intelligence, you build a portfolio that is resilient, scalable, and clinically precise. Don't leave your capital to the mercy of non-linear volatility. Use the tools designed for the sub-millisecond environment.
Deploying Institutional-Grade Capital Protection
Quantifying capital exposure with clinical precision is the only way to survive a market defined by 15% volatility. You've mastered the formulas for 99% confidence intervals. You understand why leptokurtosis renders standard bell curves obsolete. Now, you must bridge the gap between static calculation and sub-millisecond execution. Integrating AI for crypto market risk assessment is the final step in securing your portfolio against systemic liquidity crunches. Static models are a liability. Automated validation is a requirement.
Manual models provide the baseline. Automated intelligence provides the edge. Sniper AI Weekly delivers this institutional capability through 5 AI agents and an 8-layer signal filtration system. It validates every trend with technical proof. It operates on a strictly non-custodial basis. Your API key, your funds. This system mirrors the execution speed and security protocols of a high-end financial tool. It removes the linguistic clutter of speculative groups and replaces it with backtested results.
Get Started with Sniper AI Weekly: Institutional AI Intelligence. Secure your principal. Trade with the data-driven confidence of an elite technician.
Frequently Asked Questions
What is the most accurate VaR method for crypto?
Monte Carlo simulation is the most accurate method for digital assets because it accounts for non-linear price paths. Unlike the Variance-Covariance method, which assumes a normal distribution, Monte Carlo uses thousands of random iterations to capture extreme outliers. This is critical for portfolios containing DeFi yield positions or complex derivatives. It provides a realistic view of potential drawdowns during systemic liquidity shifts.
How does Value at Risk differ from standard deviation?
Value at Risk (VaR) quantifies a specific loss threshold, whereas standard deviation only measures the dispersion of returns around a mean. Standard deviation tells you how much price fluctuates. VaR tells you exactly how much capital is at risk at a 95% or 99% confidence level. For the elite technician, VaR is the superior metric because it translates volatility into a concrete dollar amount for capital protection.
Can VaR predict a crypto market crash?
VaR does not predict crashes; it quantifies exposure under normal market parameters. It identifies the maximum loss you should expect within a specific probability range. Because crypto exhibits leptokurtosis, "Black Swan" events often fall into the 1% tail that standard VaR ignores. This is why supplemental metrics like Expected Shortfall (ES) are required to understand the severity of loss when the VaR threshold is breached.
Is a 95% or 99% confidence level better for crypto?
A 99% confidence level is the institutional standard for the high-leverage 2026 crypto environment. A 95% level is often too permissive, as it suggests a significant loss could occur once every twenty days. Given the frequency of 5% to 10% daily swings, a 99% threshold provides the clinical precision needed to set effective stop-loss levels and protect principal capital against frequent market outliers.
How often should I recalculate my portfolio VaR?
Recalculate your VaR daily at a minimum, though real-time monitoring is the professional benchmark. Crypto markets operate 24/7 without circuit breakers, meaning risk profiles can shift in seconds. If your portfolio includes high-beta altcoins, static daily snapshots may miss rapid liquidity vacuums. Frequent recalibration ensures your position sizes remain optimal as volatility clusters form and dissipate across different exchange order books.
What are the limitations of using VaR for altcoins?
The primary limitation for altcoins is the liquidity gap and extreme skewness in return distributions. Many low-cap assets lack the deep order books required for stable historical modeling. During a panic, these assets often experience price gaps where no trades occur, rendering traditional VaR calculations inaccurate. AI-driven models are necessary to factor in exchange-specific depth and volume profiles to adjust for these non-linear risks.
How do AI tools like Sniper AI Weekly improve risk management?
Deploying AI for crypto market risk assessment improves management by automating the detection of volatility clusters that manual models miss. Sniper AI Weekly utilizes 5 AI agents and 8 signal filters to validate trends in real-time. This reduces emotional decision-making and saves hours of manual data analysis. It provides the sub-millisecond execution speed required to adjust risk parameters before cascading liquidations trigger a systemic portfolio drawdown.